EU Contribution by Country


| # submitted proposals | 1916 |
| # funded projects | 211 |
| Sucess rate # proposals | 11.0% |
| # participations in submitted proposals | 7828 |
| # participations in funded projects | 902 |
| Sucess rate # participations | 11.5% |
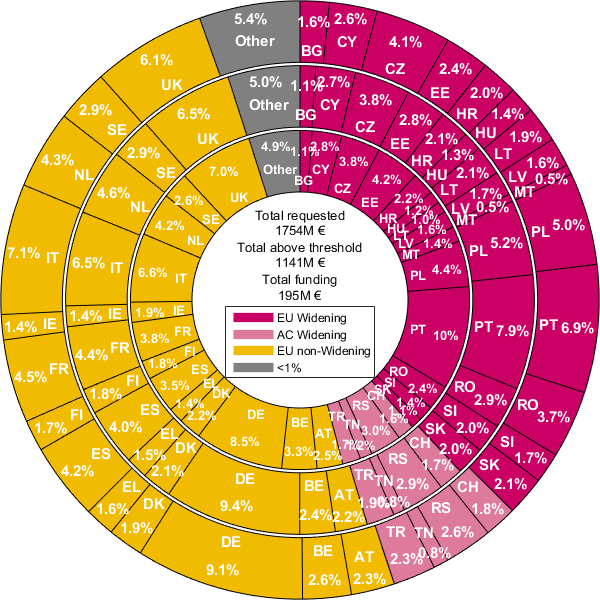
| Total Grant proposed, million EUR | 1755.7 |
| Total Grant supplied, million EUR | 195.1 |
| Sucess rate moneywise | 11.1% |
| EU contribution, million EUR | # Projects | # Participations | # Coordinations | ||||||||||
|---|---|---|---|---|---|---|---|---|---|---|---|---|---|
| Country | Country Code | Proposed | Funded | Success Rate | Proposed | Funded | Success Rate | Proposed | Funded | Success Rate | Proposed | Funded | Success Rate |
| Albania | AL | 4.6 | 0.0 | 0.0% | 18 | 0 | 0.0% | 20 | 0 | 0.0% | 15 | 0 | 0.0% |
| Armenia | AM | 9.8 | 1.5 | 15.4% | 30 | 4 | 13.3% | 30 | 4 | 13.3% | 28 | 4 | 14.3% |
| Austria | AT | 41.2 | 4.8 | 11.6% | 228 | 29 | 12.7% | 236 | 30 | 12.7% | 0 | 0 | 0.0% |
| Bosnia and Herzegovina | BA | 3.8 | 0.4 | 11.1% | 13 | 1 | 7.7% | 14 | 2 | 14.3% | 11 | 1 | 9.1% |
| Belgium | BE | 46.0 | 6.5 | 14.2% | 258 | 36 | 14.0% | 271 | 38 | 14.0% | 0 | 0 | 0.0% |
| Bulgaria | BG | 27.5 | 2.2 | 8.0% | 78 | 6 | 7.7% | 94 | 7 | 7.4% | 69 | 4 | 5.8% |
| Switzerland | CH | 30.8 | 3.1 | 10.2% | 165 | 17 | 10.3% | 172 | 17 | 9.9% | 0 | 0 | 0.0% |
| Cyprus | CY | 45.3 | 5.5 | 12.2% | 104 | 14 | 13.5% | 131 | 15 | 11.5% | 100 | 13 | 13.0% |
| Czechia | CZ | 71.6 | 7.3 | 10.2% | 184 | 19 | 10.3% | 193 | 19 | 9.8% | 162 | 15 | 9.3% |
| Germany | DE | 159.6 | 16.5 | 10.3% | 812 | 86 | 10.6% | 934 | 105 | 11.2% | 0 | 0 | 0.0% |
| Denmark | DK | 33.5 | 4.3 | 12.7% | 174 | 23 | 13.2% | 182 | 23 | 12.6% | 0 | 0 | 0.0% |
| Estonia | EE | 42.1 | 8.1 | 19.3% | 106 | 20 | 18.9% | 116 | 21 | 18.1% | 96 | 20 | 20.8% |
| Greece | EL | 28.3 | 2.8 | 9.9% | 164 | 15 | 9.1% | 178 | 16 | 9.0% | 0 | 0 | 0.0% |
| Spain | ES | 73.2 | 6.8 | 9.4% | 418 | 39 | 9.3% | 445 | 45 | 10.1% | 0 | 0 | 0.0% |
| Finland | FI | 29.7 | 3.5 | 11.7% | 156 | 19 | 12.2% | 164 | 20 | 12.2% | 0 | 0 | 0.0% |
| Faroe Islands | FO | 1.5 | 0.0 | 0.0% | 2 | 0 | 0.0% | 5 | 0 | 0.0% | 2 | 0 | 0.0% |
| France | FR | 79.0 | 7.4 | 9.3% | 413 | 41 | 9.9% | 456 | 60 | 13.2% | 0 | 0 | 0.0% |
| Georgia | GE | 4.1 | 0.0 | 0.0% | 15 | 0 | 0.0% | 17 | 0 | 0.0% | 12 | 0 | 0.0% |
| Croatia | HR | 34.6 | 4.2 | 12.2% | 100 | 10 | 10.0% | 140 | 20 | 14.3% | 87 | 9 | 10.3% |
| Hungary | HU | 25.1 | 2.3 | 9.2% | 79 | 7 | 8.9% | 81 | 7 | 8.6% | 58 | 7 | 12.1% |
| Ireland | IE | 23.9 | 3.7 | 15.6% | 119 | 17 | 14.3% | 120 | 17 | 14.2% | 0 | 0 | 0.0% |
| Israel | IL | 9.5 | 1.5 | 16.2% | 58 | 10 | 17.2% | 58 | 10 | 17.2% | 0 | 0 | 0.0% |
| Iceland | IS | 0.5 | 0.0 | 0.0% | 3 | 0 | 0.0% | 3 | 0 | 0.0% | 0 | 0 | 0.0% |
| Italy | IT | 123.7 | 12.8 | 10.3% | 624 | 73 | 11.7% | 709 | 78 | 11.0% | 0 | 0 | 0.0% |
| Lithuania | LT | 33.9 | 2.0 | 6.0% | 92 | 5 | 5.4% | 104 | 6 | 5.8% | 84 | 5 | 6.0% |
| Luxembourg | LU | 5.6 | 1.7 | 29.5% | 29 | 8 | 27.6% | 30 | 8 | 26.7% | 6 | 2 | 33.3% |
| Latvia | LV | 27.6 | 3.2 | 11.6% | 66 | 8 | 12.1% | 76 | 8 | 10.5% | 62 | 8 | 12.9% |
| Moldova | MD | 5.7 | 1.5 | 26.8% | 15 | 3 | 20.0% | 16 | 3 | 18.8% | 14 | 3 | 21.4% |
| Montenegro | ME | 2.9 | 0.0 | 0.0% | 7 | 0 | 0.0% | 9 | 0 | 0.0% | 7 | 0 | 0.0% |
| Macedonia | MK | 5.4 | 0.2 | 4.5% | 17 | 1 | 5.9% | 18 | 1 | 5.6% | 15 | 1 | 6.7% |
| Malta | MT | 9.4 | 2.8 | 29.9% | 29 | 7 | 24.1% | 32 | 9 | 28.1% | 23 | 7 | 30.4% |
| Netherlands | NL | 74.6 | 8.1 | 10.9% | 365 | 41 | 11.2% | 395 | 48 | 12.2% | 0 | 0 | 0.0% |
| Norway | NO | 24.8 | 1.8 | 7.2% | 122 | 10 | 8.2% | 130 | 10 | 7.7% | 0 | 0 | 0.0% |
| Poland | PL | 87.8 | 8.5 | 9.7% | 231 | 19 | 8.2% | 265 | 22 | 8.3% | 202 | 18 | 8.9% |
| Portugal | PT | 121.2 | 19.2 | 15.9% | 288 | 43 | 14.9% | 341 | 63 | 18.5% | 253 | 39 | 15.4% |
| Romania | RO | 64.0 | 4.6 | 7.2% | 179 | 13 | 7.3% | 187 | 13 | 7.0% | 167 | 13 | 7.8% |
| Serbia | RS | 45.2 | 5.8 | 12.8% | 120 | 16 | 13.3% | 124 | 16 | 12.9% | 112 | 15 | 13.4% |
| Sweden | SE | 50.4 | 5.0 | 9.9% | 268 | 28 | 10.4% | 282 | 28 | 9.9% | 0 | 0 | 0.0% |
| Slovenia | SI | 29.0 | 2.8 | 9.7% | 93 | 9 | 9.7% | 99 | 9 | 9.1% | 56 | 5 | 8.9% |
| Slovakia | SK | 37.1 | 2.1 | 5.5% | 107 | 6 | 5.6% | 115 | 6 | 5.2% | 94 | 6 | 6.4% |
| Tunisia | TN | 14.6 | 2.3 | 15.6% | 40 | 6 | 15.0% | 50 | 9 | 18.0% | 40 | 6 | 15.0% |
| Turkey | TR | 40.3 | 3.4 | 8.4% | 109 | 9 | 8.3% | 112 | 9 | 8.0% | 97 | 8 | 8.2% |
| Ukraine | UA | 16.6 | 0.8 | 5.1% | 56 | 3 | 5.4% | 59 | 3 | 5.1% | 44 | 2 | 4.5% |
| United Kingdom | UK | 107.8 | 13.7 | 12.7% | 513 | 68 | 13.3% | 575 | 74 | 12.9% | 0 | 0 | 0.0% |